Stakeholders are the future.
Our eighth week at SMSC explored the human side of conservation, specifically evaluating the importance of stakeholders and how to set priorities in conservation projects. This was done through a week of stakeholder assessment and different activities to familiarize us with stakeholders we may encounter and the different influences and powers they have. Our specific animal of choice to focus on during this exersize was the Northern Bobwhite Quail [NOBO] (Colinus virginianus).
Our first task was to identify stakeholders in the conservation of the NOBO. Some of the main stakeholders identified were landowners, developers, the National Park Service, and local government officials. These key stakeholders were then ranked on their influence and impact. Once we identified the stakeholders, we turned our eyes to the threats faced by the NOBO. The major threats to the NOBO are similar to almost every threatened species, decline in habitat, pollution, over predation, etc. For our class, we decided to focus on hunting and habitat loss as our major threats. We then identified, through modeling and copius amounts of paper diagrams on the classroom walls, the ways that these threats were impacting the NOBO and ways to mitigate these threats.
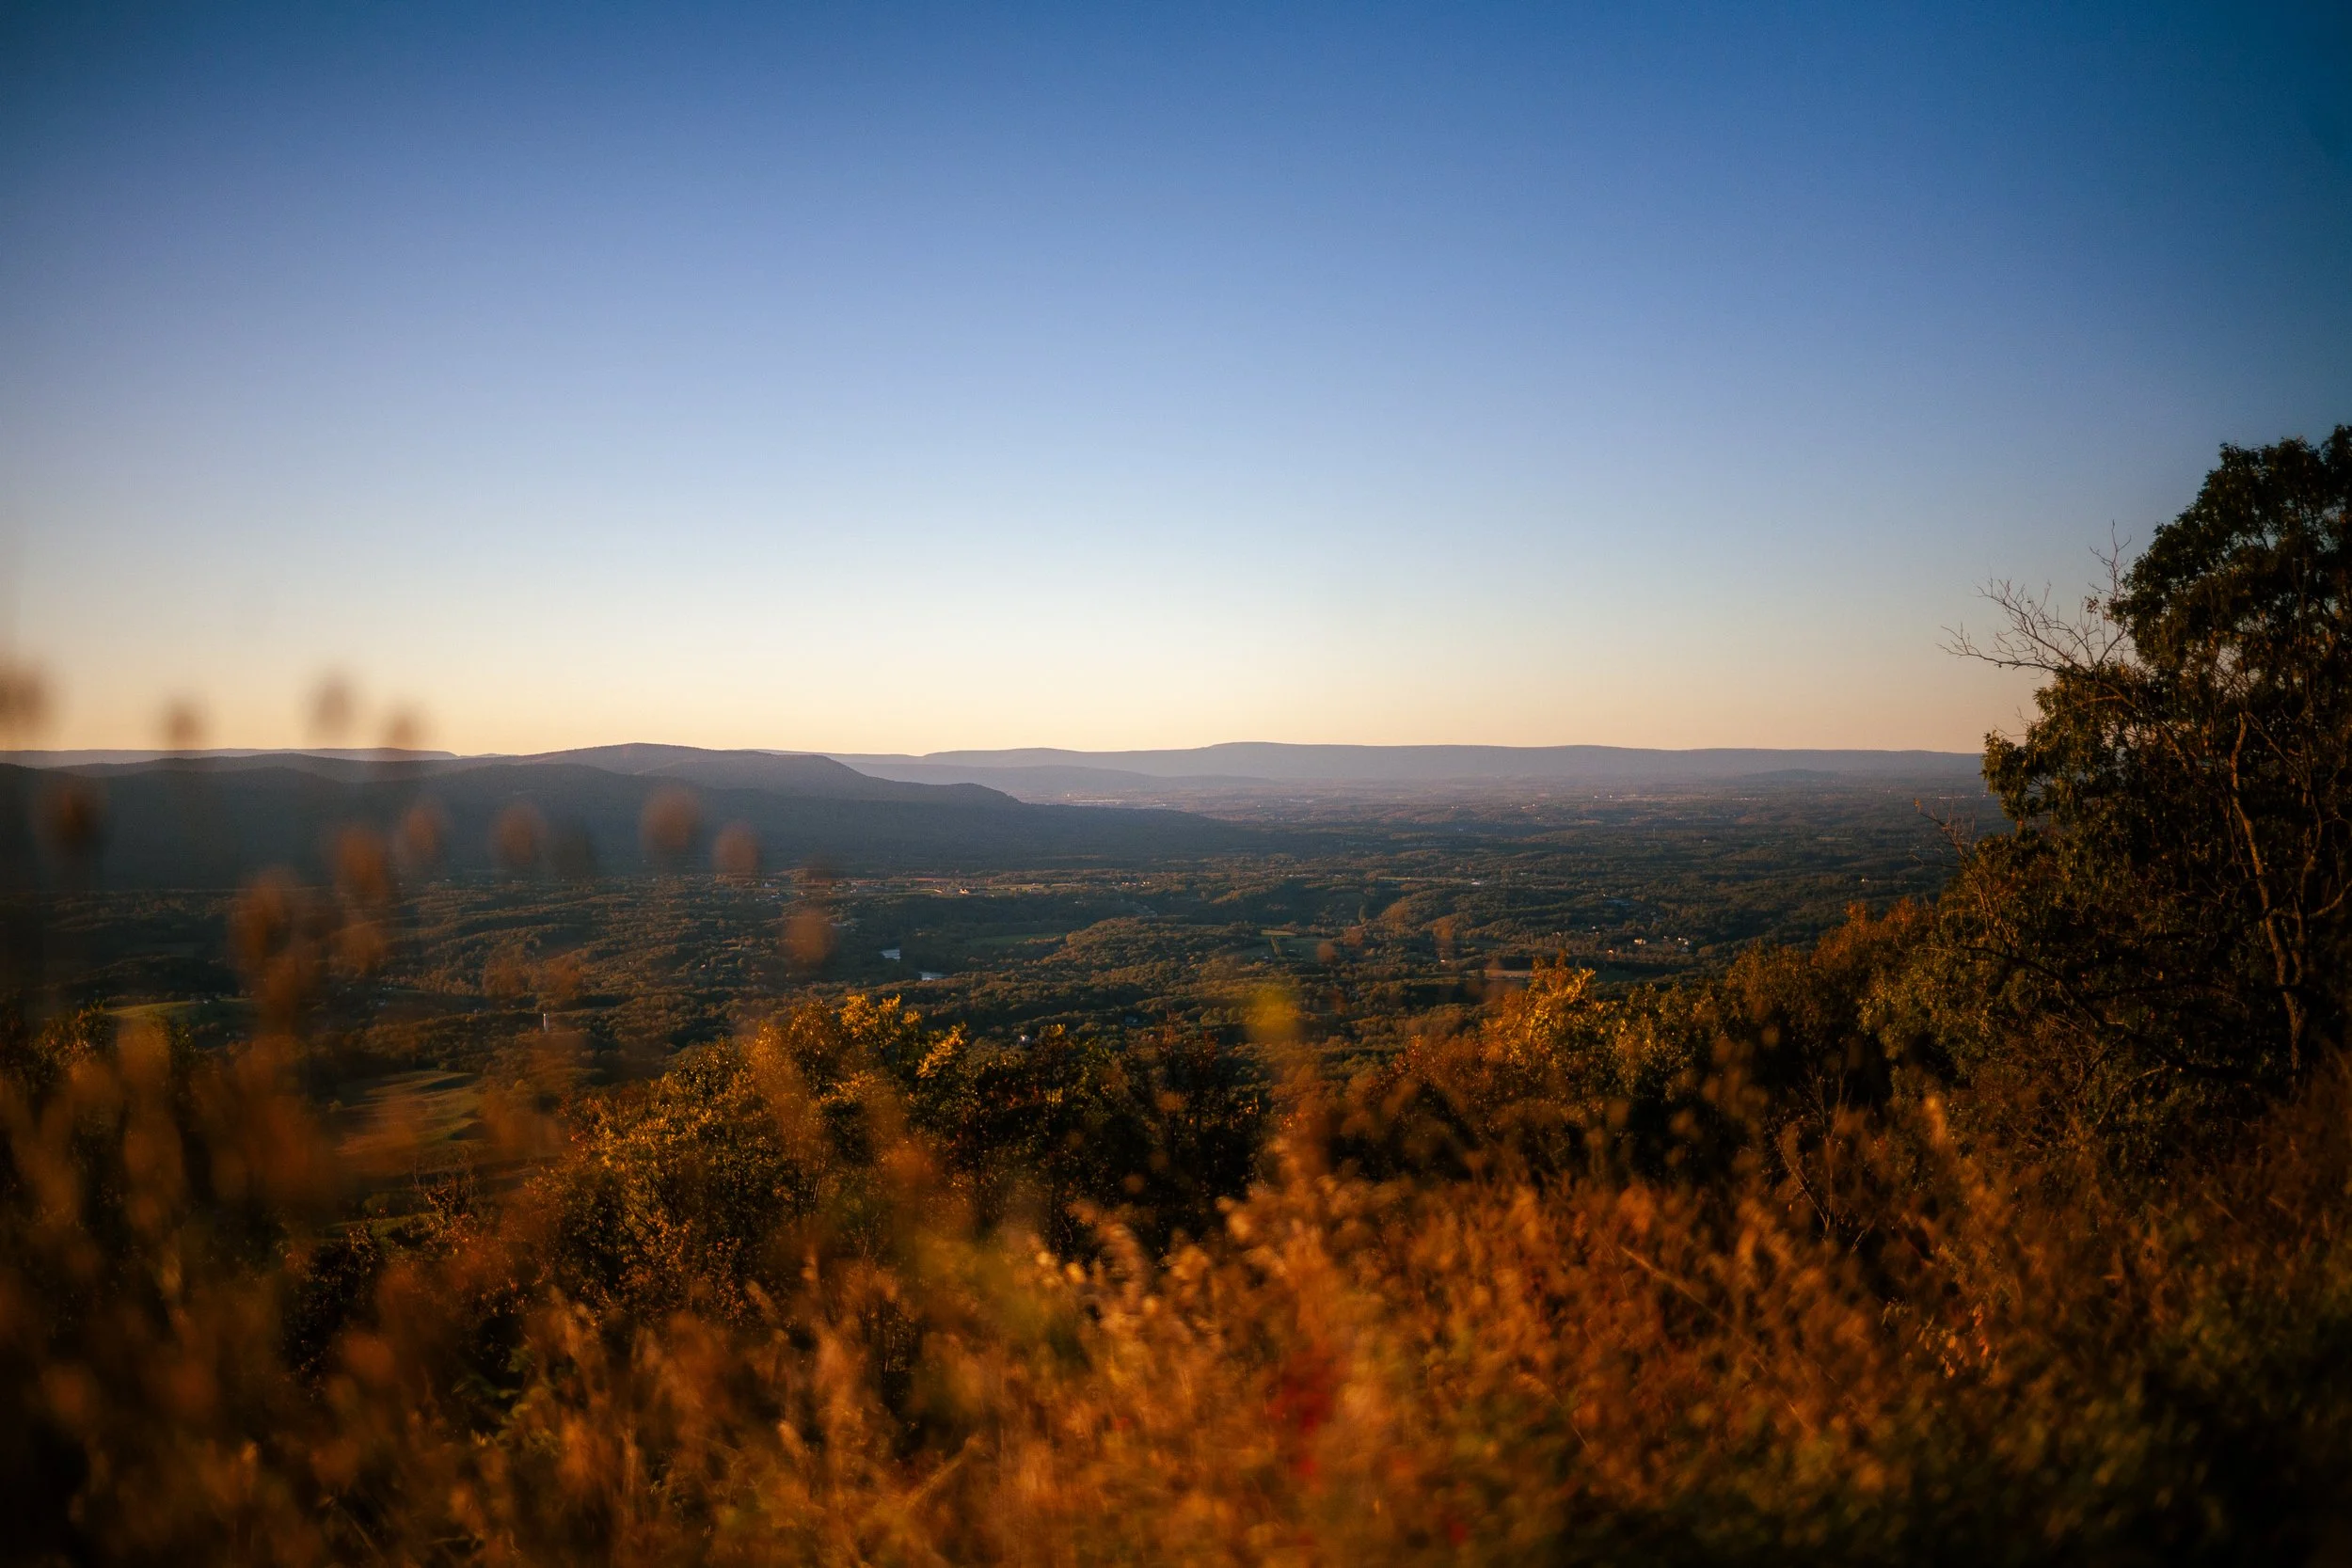
My personal favorite activity we did during the week was the NOBO habitat quality analysis. My main interests in environmental science are land use, mapping, and modeling, and the habitat quality analysis was right up my alley. For the habitat analysis, we measured habitat quality in two sample areas (1m transect) in a patch of cool season grasses (CSG) and a patch warm season grasses (WSG). We carried a Garmin GPS with us to mark our locations where we sampled the grasses. We then measured ground cover, terrestrial predation, and aerial predation using some protractors and other rudimentary measuring devices. We then took this data and plotted it in Google Maps, and categorized the points by color to show what was the best habitat for the NOBO was.
Showing data visually is critical in the field of conservation. As our world moves more towards visual means of communication (TikTok, Reels, etc.), visualizing data and being able to represent it to a large group of people is essential. Being able to show someone visually on a map, a segment of land that is better for NOBO conservation, could be the difference between a project being approved and a project being denied. I think that combining data visualization into a video format, could be used widely in conservation communication to represent conservation factors such as habitat degradation and loss, pollutant concentrations, and air quality.
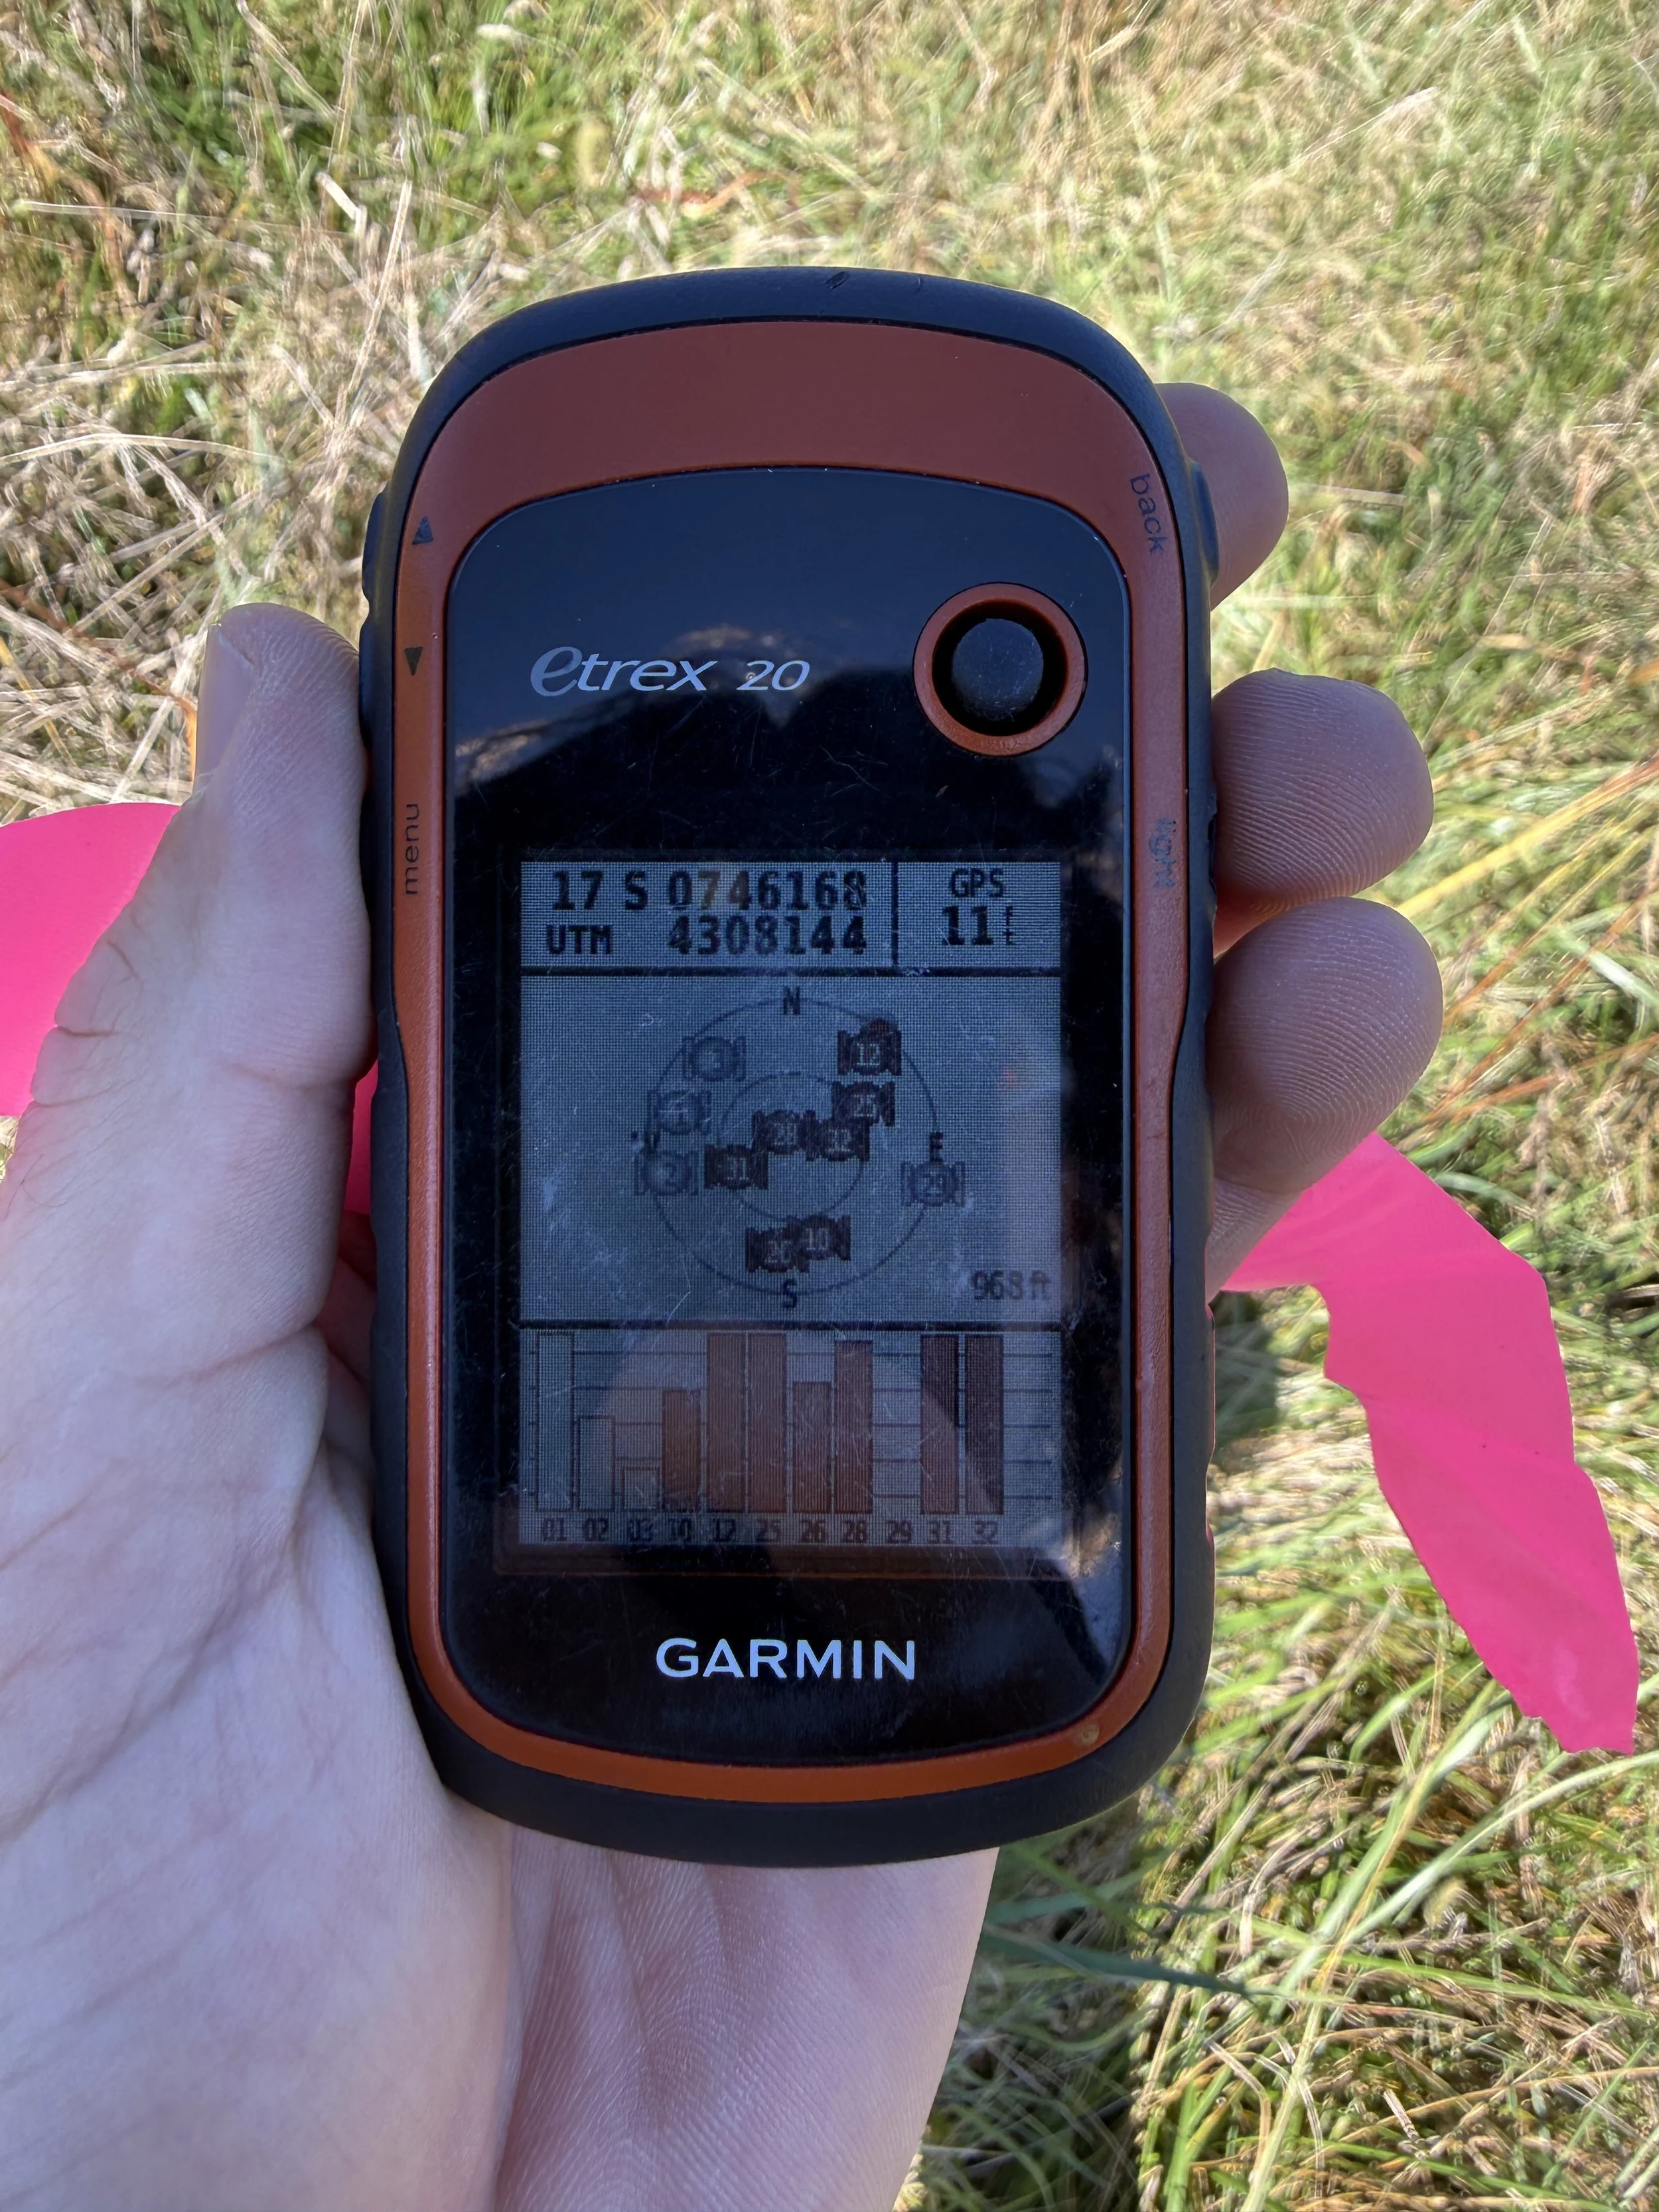
Handheld GPS allows us to locate ourselves precisely to map our survey sites on Google Earth to evaluate habitat quality for the Northern Bobwhite Quail (Colinus virginianus)